RevPAR: What to Know, How to Calculate It, and How to Use It Strategically
RevPAR: What to Know, How to Calculate It, and How to Use It Strategically
If you operate a vacation rental or manage a portfolio of short-term rental properties, understanding your numbers is non-negotiable. One of the most valuable metrics in hospitality revenue management is RevPAR, short for Revenue Per Available Room. Though it originated in the hotel industry, RevPAR has quickly become a critical benchmark for Airbnb hosts, VRBO owners, and property managers aiming to optimize pricing and improve occupancy.
RevPAR gives you insight into how well you're monetizing your inventory. It does this by combining both your average daily rate (ADR) and your occupancy rate into a single, easy-to-track metric. Unlike metrics that only look at revenue or booking percentage, RevPAR captures the relationship between price and demand.
Put simply, if you're serious about increasing your earnings, RevPAR should be on your dashboard.
What Is RevPAR?
Revenue Per Available Room (RevPAR) is a metric that tells you how much money you're making for every night a room is available—whether it’s booked or not. In the vacation rental space, that means each calendar night that your property is listed and ready to book.
RevPAR is not just about how many bookings you get. It also factors in how much you're charging per night. This makes it one of the most comprehensive top-line metrics for evaluating the financial performance of a short-term rental.
For hotel managers, RevPAR has long been used to track financial health, evaluate strategies, and benchmark against competitors. Today, STR operators are using it the same way—especially with platforms like AirDNA, PriceLabs, and Wheelhouse making RevPAR data more accessible.
How to Calculate RevPAR
There are two common formulas used to calculate RevPAR. Both are equally valid and will produce the same result when data is accurate.
Formula 1: Room Revenue ÷ Available Room Nights
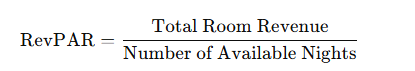
This method is particularly useful for vacation rentals because it accounts for the entire availability calendar—regardless of whether the property was booked.
Formula 2: Average Daily Rate × Occupancy Rate
Example Calculation for a Vacation Rental
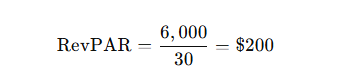
Let’s say your Airbnb earned $6,000 in gross booking revenue in a month where it was listed for 30 days.
- ADR (Average Daily Rate): $200
- Occupancy Rate: 66.7% (20 nights booked out of 30)
- Total Room Revenue: $6,000
- Available Nights: 30
Using Formula 1:
Using Formula 2:
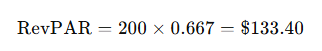
These different results stem from how “available” is defined. In Formula 1, you assume the unit is available every day. In Formula 2, the occupancy rate narrows down the booked portion. Both are useful, but Formula 1 better reflects the total monetization potential of your inventory.
RevPAR Comparison Example – Hotel vs. Vacation Rental
| Metric | Hotel (100 Rooms) | Vacation Rental (1 Unit) |
|---|---|---|
| Total Room Revenue | $150,000/month | $6,000/month |
| Available Room Nights | 3,000 | 30 |
| Occupancy Rate | 80% | 66.7% |
| ADR | $62.50 | $200 |
| RevPAR (Formula 1) | $50 | $200 |
| RevPAR (Formula 2) | $62.50 × 0.80 = $50 | $200 × 0.667 = $133.40 |
RevPAR vs. ADR vs. Occupancy Rate
Many new hosts pay close attention to ADR or Occupancy Rate, but miss the bigger picture. RevPAR helps you bridge that gap.
| Metric | What It Measures | What It Misses |
|---|---|---|
| ADR | Average revenue per booked night | Ignores unbooked nights |
| Occupancy Rate | Percentage of nights booked | Doesn’t account for price |
| RevPAR | Revenue per available night | Doesn’t include expenses or costs |
RevPAR tells you how well you’re utilizing your inventory and how much money it’s bringing in per available night. It’s the best way to evaluate revenue performance holistically.
Strategic Uses of RevPAR
Understanding how to calculate RevPAR is important—but knowing how to use it is what gives you the competitive edge. For vacation rental owners and property managers, RevPAR isn’t just a number on a dashboard. It’s a decision-making tool that guides pricing, availability strategy, performance comparisons, and portfolio management.
Here’s how to make it work for you.
Revenue Forecasting and Performance Tracking
RevPAR helps you project future revenue and evaluate the success of recent decisions. If your RevPAR is increasing over time, it could mean:
- Your pricing strategy is working
- You're booking more nights at higher rates
- Market demand is rising
If RevPAR is flat or declining, it signals a need to re-evaluate your listing, pricing, or availability.
Use RevPAR in tandem with occupancy and ADR to determine where the breakdown is happening:
| Scenario | ADR Trend | Occupancy Trend | RevPAR Result | Possible Issue |
|---|---|---|---|---|
| High ADR, Low Occupancy | ↑ | ↓ | Flat or ↓ | Pricing too high for current demand |
| Low ADR, High Occupancy | ↓ | ↑ | Flat or ↓ | Pricing too low; leaving money on the table |
| Moderate ADR, Moderate Occupancy | → | → | ↑ | Improving efficiency over time |
Use this to diagnose what RevPAR is signaling about your STR business
Benchmarking Against the Market
You can’t improve what you can’t compare. That’s where RevPAR benchmarking comes in.
1. RevPAR Index (or Revenue Generating Index - RGI)
The RevPAR Index compares your property’s RevPAR to a selected set of competitors or the overall market. It’s calculated as:
RevPAR Index=(Your RevPARMarket or Comp Set RevPAR)×100\text{RevPAR Index} = \left( \frac{\text{Your RevPAR}}{\text{Market or Comp Set RevPAR}} \right) \times 100
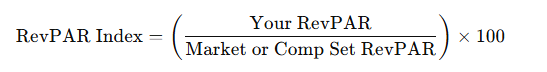
- 100 = Average performance
- Above 100 = Outperforming your comp set
- Below 100 = Underperforming the market
This index is standard in hotel performance analysis and is now supported by short-term rental tools such as AirDNA, Key Data, and Transparent.
2. Local & Seasonal Benchmarking
If you're managing in a seasonal destination—whether it’s ski-in/ski-out cabins in Oregon or beach houses in Florida—comparing your RevPAR year-over-year for the same season is essential.
- Compare March 2025 to March 2024, not to January.
- Identify trends that reflect demand surges, event-driven traffic, or local economic shifts.
Guiding Pricing and Availability Strategy
RevPAR directly supports dynamic pricing and calendar optimization.
If RevPAR is lower than expected:
- Review your minimum night stay rules
- Open up more availability in high-demand periods
- Use booking restrictions more strategically (e.g., no gaps between bookings)
If RevPAR is growing:
- Consider raising your base nightly rate
- Test premium pricing during high-traffic weekends or local events
- Limit discounts during peak demand periods
Pricing tools like Wheelhouse, PriceLabs, and Beyond can automate this process, but it's important to understand what their suggestions are based on—and RevPAR is a key driver in most algorithms.
Multi-Property Performance Optimization
For property managers overseeing several listings, RevPAR can be used to:
- Rank properties by revenue efficiency
- Identify underperforming units
- Allocate marketing resources to the highest-potential properties
- Justify pricing to homeowners and investors with data-backed logic
| Property | ADR | Occupancy | RevPAR | Notes |
|---|---|---|---|---|
| Mountain Cabin A | $225 | 50% | $112.50 | High price, needs better fill |
| Urban Loft B | $145 | 85% | $123.25 | Well-balanced performance |
| Lake House C | $310 | 35% | $108.50 | Underbooked, consider promos |
Improving RevPAR: Tactics and Tools
Raising RevPAR isn’t just about charging more or booking more nights—it’s about doing both strategically. Below are proven ways vacation rental professionals can improve RevPAR across different property types and markets.
Dynamic Pricing Optimization
Use smart pricing tools that automatically adjust your nightly rates based on demand, competition, and seasonality.
Recommended platforms:
- PriceLabs: Custom rule-setting, minimum stay logic, and market comparison
- Wheelhouse: Tailors pricing to brand strategy (e.g., premium vs. budget)
- Beyond: Includes RevPAR benchmarks and pacing analysis
Dynamic pricing helps you maximize revenue during peak demand without overpricing during slow periods.
Strategic Minimum Stay Rules
While longer minimum stays reduce cleaning costs and guest churn, they also shrink your booking window. Consider:
- Shortening minimum stays mid-week or during shoulder seasons
- Offering discounts on 3+ night stays instead of requiring them
- Avoiding “orphan nights” by enabling flexible check-in/check-out days
Small calendar tweaks often result in a meaningful RevPAR lift over time.
Calendar Availability Management
Ensure your property is available during high-demand periods. Too many calendar blocks (for owner use, maintenance, or gaps) can harm your RevPAR.
Tips:
- Re-open previously blocked dates when demand surges
- Keep your calendar synced across all platforms
- Avoid setting arbitrary future blocks “just in case”
Every available night is potential revenue—use it.
Invest in Guest Experience and Reviews
Higher guest satisfaction increases your occupancy rate and allows you to raise your nightly rate without hurting demand. This, in turn, increases RevPAR.
Focus areas:
- Response time and guest communication
- Cleanliness and amenities that guests love (e.g. pools, hot tubs, fire pits)
- Upsells (e.g., early check-in, guided experiences)
- High-quality listing photos and accurate descriptions
A small investment in presentation and service has compounding returns.
Caveats and Limitations of RevPAR
While RevPAR is incredibly useful, it doesn’t tell the full story. Here are several limitations to keep in mind:
1. RevPAR Does Not Measure Profit
RevPAR is a top-line metric. It doesn’t account for expenses such as:
- Cleaning fees
- Platform commissions
- Utility costs
- Property management fees
You might have high RevPAR but low profitability, especially in high-cost markets or with inefficient operations.
2. Can Be Misleading Without Context
- A luxury property may have a lower occupancy rate but higher RevPAR due to its high ADR.
- A property with high occupancy but low rates might be underperforming relative to its potential.
Always pair RevPAR with ADR and Occupancy Rate to identify where improvements can be made.
3. Not a Fit for All Properties
Some vacation rentals have multiple units, guest houses, or event spaces. In these cases, calculating RevPAR as “per room” may not make sense. You may want to use RevPAN (Revenue per Available Night) or create custom metrics that reflect how your listing functions in practice.
Complementary Metrics for a Complete View
To get a holistic understanding of your vacation rental’s performance, consider tracking these alongside RevPAR:
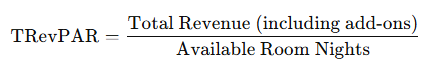
A. TRevPAR (Total Revenue Per Available Room)
Includes all sources of revenue—not just nightly rates. For STRs, this might mean:
- Cleaning fees
- Upsell services (e.g., hot tub use, early check-in)
- Pet fees or add-ons
Net RevPAR or ARPAR (Adjusted Revenue Per Room)
This metric subtracts variable costs from revenue to reflect profit per available night.
Useful when you want to compare how efficiently different listings generate net income, not just top-line revenue
GOPPAR (Gross Operating Profit Per Available Room)
Common in hotels, GOPPAR includes all income and subtracts operating expenses. For STRs, you might adapt this by calculating:
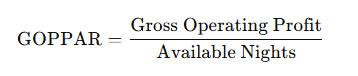
Use this when you manage multiple listings and want to compare their financial viability at the portfolio level.
Conclusion
RevPAR is more than just a hospitality metric—it’s one of the most reliable indicators of how well your vacation rental is converting availability into revenue. Whether you're managing a single Airbnb or a regional portfolio, tracking RevPAR over time allows you to identify underperformance, guide pricing, and optimize your calendar for profitability.
But metrics like RevPAR are only as powerful as the action they inspire.
At BNB Construction, we specialize in turning performance data into real-world results. We work exclusively with short-term rental owners and investors who want to unlock the full potential of their properties. From custom amenities like home theaters and outdoor living areas to full-scale renovations that elevate a space’s appeal and nightly rate, our team is here to help you optimize for better bookings, stronger reviews, and increased revenue.
With decades of combined construction and STR expertise, our team at BNB Construction knows what works—and we’ve proven it across urban, coastal, mountain, and rural markets alike. We focus on guest-ready designs, efficient timelines, and smart investment strategies to make sure your upgrades deliver real returns. We even track amenity data through tools like AirDNA to ensure what you're building aligns with what guests are searching for.
Let’s build your vision.
If you're ready to turn your vacation rental into a high-performing, guest-attracting space, we’re ready to help. Contact BNB Construction today to speak directly with our leadership team and get started on a renovation strategy that makes sense for your goals—and your market.
Share to social media
More posts